Futureproof and scale your zero-emission bus operation.
From any computer. In 4 simple steps.
Inefficient and costly: The dangers of adopting zero-emission buses without understanding their future operating costs
Decarbonizing your bus operations comes with many challenges, whether you are running a pilot or scaling your zero-emission operations. Lack of operational data, high up-front capital costs, requirements to upgrade the infrastructure, and technical limitations of zero-emission buses are just a few challenges to name. Adopting zero-emission buses without understanding their future operating performance and their total operating costs will be inefficient and costly, making it impossible to scale beyond an initial pilot project.
Achieve efficient and cost-effective zero-emission bus operations with our route-by-route analysis
Our platform zero-emission bus (ZEB) predicts multiple scenarios of any future operation and provides virtual insights into your future bus operations, charging requirements, the TCO, carbon footprint, and much more.

Understand ZEB performance and charging
The lack of operational data, range, and power limitations of zero-emission buses means that ZEBs are often used inefficiently. With our route-by-route, you can understand any ZEB performance over any service, including state of charge, charging requirements, downtime, CO2 savings, and more.

Lower the total cost of ownership
High up-front costs and a lack of data on the total costs of operations can slow down or completely halt your adoption of ZEBs. Thanks to our tool, you can have a clear overview of the total cost of operations no matter the size of your fleet.

Scale your operation past the pilot
A successful expansion beyond the pilot phase is impossible without a full picture of the capital and infrastructure requirements. By using our platform, you can predict the investment, charging, future CO2 reduction, and other requirements of fleets of any size.
How it works: An easy 4-step process
Step 2.
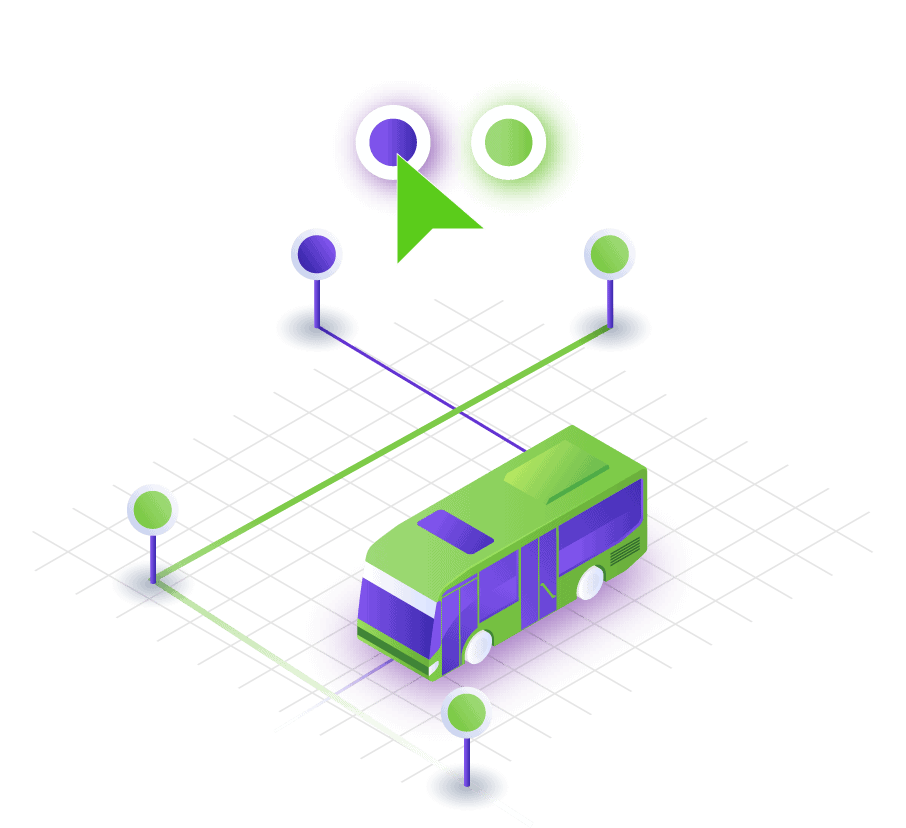
Select a bus service
Select your preferred service and see the elevation, speed profile, distance and time drove in a day and stops on the visual map.
Step 3.
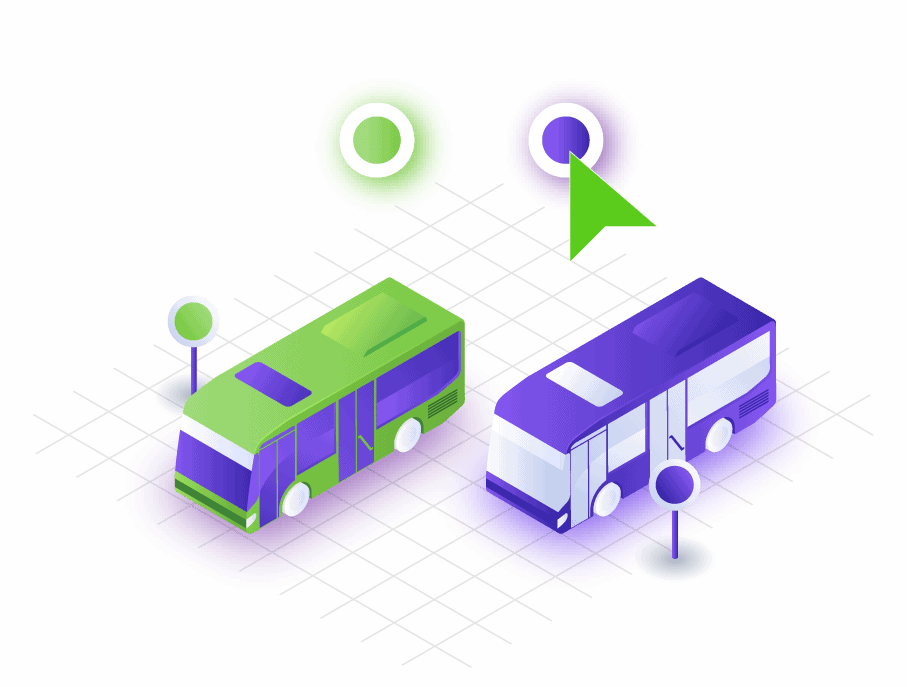
Select an zero-emission bus
Select a model of your choice, and immediately see valuable specs about the model such as range, length, maximum speed, capacity, and more.
Step 4.
Simulate and compare
Run your simulation, start tracking different zero-emission bus performances and analyze your KPIs. See which model, and where, performs the best.
Streamline your bus operations with tailor-made results

Performance
Understand how different models perform over different bus services. Get insights into real range, consumption and state-of-charge over a service, battery performance, discharge rate probability, and more.

Charging
Get a better understanding of the requirements for charging infrastructure, power peaks, and grid requirements. See the planning of charging times during breaks and in a depo.

Financials
Know what to expect for operation costs per km and per service. Understand your capital costs for the electrification process, TCO per e-bus, and the expected ROI.

Carbon Footprint
See exact CO2 savings per year and understand emissions and carbon footprint with a click of a button.
Scalable results a click away
Easily scale your operations by batching and comparing multiple scenarios, accessing your history at any time, and getting raw data simulation outputs for additional processing.

