Demonstrate your zero-emission bus capabilities anywhere in the world.

From any computer. In 4 simple steps. 

Doomed to an unnecessary expense, long sales cycles, and delay in your zero-emission bus program adoption? Your customers need to know how your zero-emission buses perform in different situations, and that requires physical testing. Or does it?

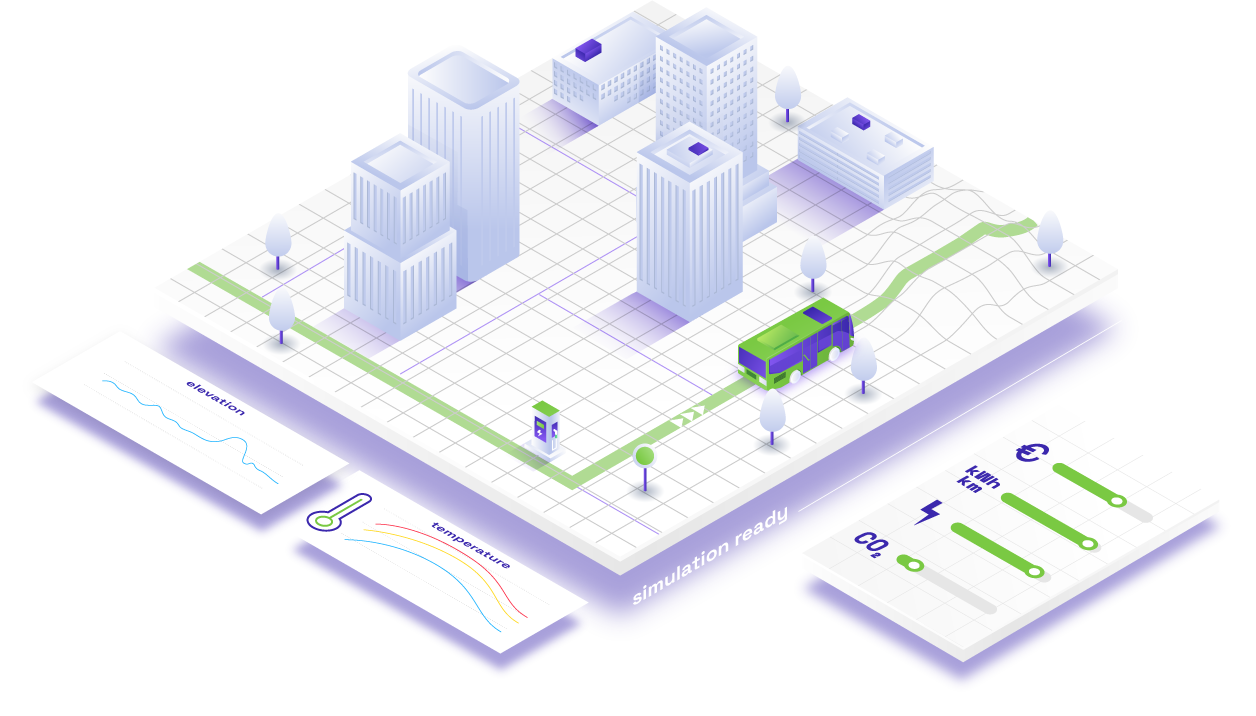
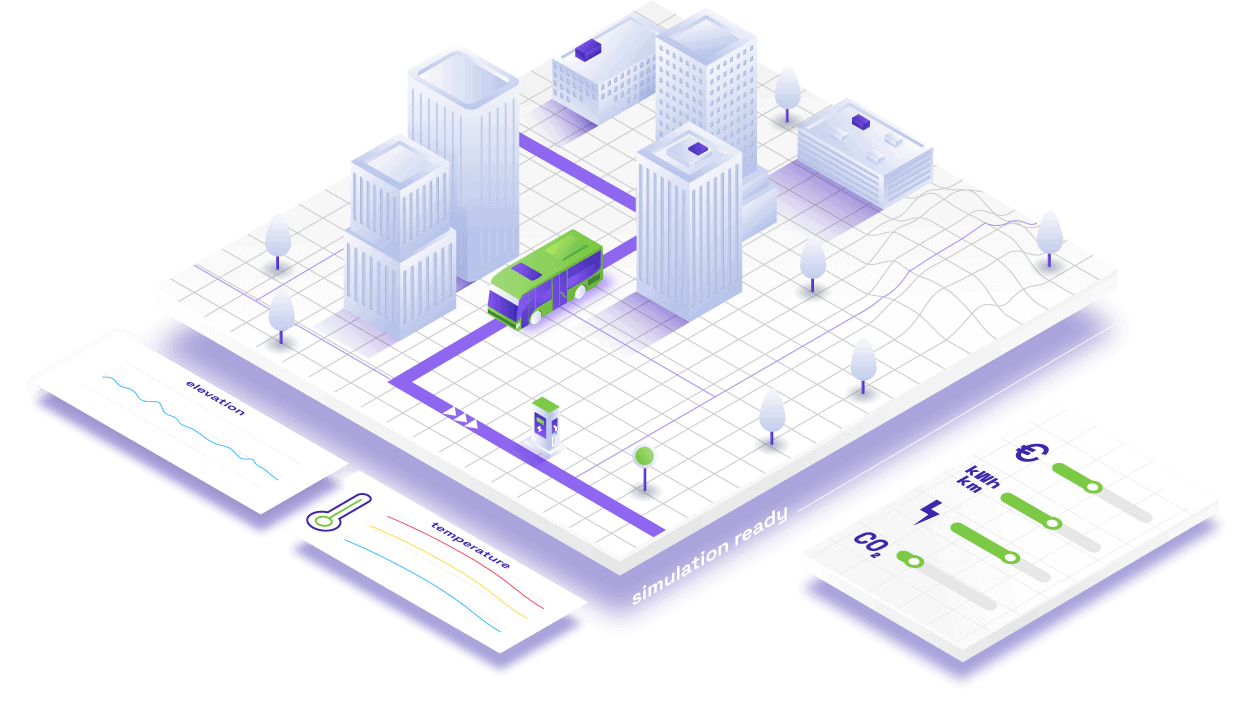
Enter virtual reality with zero-emission bus simulator. Replace physical testing with computer simulation and see how multiple scenarios of zero-emission bus operation play out in 4 steps without ever leaving your screen.

Value Proposition

Shorten your sales cycles and cut your costs

Take advantage of our modern software, skip physical testing and decrease your cost of doing business by up to 60%. In just 4 easy steps show your customers which model fits their needs and shorten your sales cycles by up to 3 months.

Ease the zero-emission bus adoption for your customers

The adoption of zero-emission buses comes with its own challenges. Run the simulation and immediately show your customers how different models perform over different bus lines, showcasing insights into performance, TCO, charging requirements, uptime, and more.

Be the leader in zero-emission bus adoption

With our white label solution for simulating zero-emission bus operation, you know exactly which of your zero-emission bus models to offer to your customers in just 4 easy steps. Adopt a new innovative approach powered by AI and become the leader in electrification.

“Together with Tirn Technology, we worked on sensitivity analysis for real-world simulation of zero-emission buses. We combined simulation techniques and statistical know-how to identify the critical parameters and therefore improve the precision of energy consumption prediction. Performing high-quality driving simulations can substitute physical testing of electric buses when electrifying public transport operations.”

Michael Kalab
Researcher at Virtual Vehicle Research GmbH

How it works

Step 1.

Select a city

Choose from any city using GTFS format maps and get an immediate overview of the city information such as population density, yearly temperatures, and more.

Step 2.

Select a line

Select your preferred line and see the elevation, speed profile, distance and time drove in a day and stops on the visual map.

Step 3.

Select a zero-emission bus

Select a model of your choice, and immediately see valuable specs about the model such as range, length, maximum speed, capacity, and more.

Step 4.

Simulate and compare

Run your simulation, start tracking different zero-emission bus performances and analyze your KPIs. See which model, and where, performs the best.

Results

Performance

Understand how different models perform over different bus lines. Get insights into real range, consumption and state-of-charge over a line, battery performance, discharge rate probability, and more.

Charging

Get a better understanding of the requirements for charging infrastructure, power peaks, and grid requirements. See the planning of charging times during breaks and in a depo.

Financials

Know what to expect for operation costs per km and per line. Understand your capital costs for the electrification process, TCO per zero-emission bus, and the expected ROI.

Carbon Footprint

See exact CO2 savings per year and understand emissions and carbon footprint with a click of a button.

Scalable solution

Easily scale your operations by batching and comparing multiple scenarios, accessing your history at any time, and getting raw data simulation outputs for additional processing.

Arrow-up